

目录导航
项目地址
GitHub: https://github.com/kitabisa/teler
下载地址
GitHub
teler_0.0.4_checksums.txt673 Bytes
teler_0.0.4_linux_386.tar.gz4.38 MB
teler_0.0.4_linux_amd64.tar.gz4.54 MB
teler_0.0.4_linux_arm64.tar.gz4.17 MB
teler_0.0.4_linux_armv6.tar.gz4.27 MB
teler_0.0.4_macOS_amd64.tar.gz4.76 MB
teler_0.0.4_windows_386.zip4.32 MB
teler_0.0.4_windows_amd64.zip4.48 MB
Source code(zip)Source code(tar.gz)
雨苁网盘
https://w.ddosi.workers.dev/github/teler/
迅雷网盘
pan.xunlei.com 提取码: XLeW
teler是基于Web日志的实时入侵检测和威胁警报工具,该日志在终端中运行,具有由社区收集和提供的资源
特征
- 实时:实时分析日志并识别可疑活动。
- 报警:Teler在检测到威胁时提供警报,推送通知包括Slack,Telegram和Discord。
- 监控:如果您想轻松监控威胁,我们有自己的指标,为此,我们使用Prometheus。
- 最新资源:不断更新。
- 最少的配置:您可以仅对日志文件运行它,编写日志格式,然后让Teler分析日志并向您显示警报!
- 灵活的日志格式:teler允许任何自定义日志格式字符串!这完全取决于您如何在配置文件中写入日志格式。
- 增量日志处理:需要数据持久性而不是缓冲区流吗?teler可以通过磁盘持久性选项逐步处理日志。
为什么要使用teler?
teler被设计为一种基于终端的快速威胁分析器。它的核心思想是实时快速分析和发现威胁!
演示
以下是teler使用条件的预览:
缓冲流 [Buffer-streams]
[增量] Incremental
安装方法
二进制安装
安装容易。您可以从发布页面下载预编译的二进制文件,解压缩并运行!或运行:
curl -sSfL 'https://ktbs.dev/get-teler.sh' | sh -s -- -b /usr/local/bin
使用Docker
通过运行以下命令拉取Docker映像:
docker pull kitabisa/teler
源安装
如果您已经安装并配置了go1.14 +编译器:
GO111MODULE=on go get -v -u ktbs.dev/teler/cmd/teler
为了更新该工具,您可以-u在go get命令中使用flag 。

GitHub安装
git clone https://github.com/kitabisa/teler
cd teler
make build
mv ./bin/teler /usr/local/bin
teler用法
简单来说,teler可以这样运行:
[buffers] | teler -c /path/to/config/teler.yaml
# 或者
teler -i /path/to/access.log -c /path/to/config/teler.yaml
如果您已使用Docker映像构建了Teler:
[buffers] | docker run -i --rm -e TELER_CONFIG=/path/to/config/teler.yaml teler
# 或者
docker run -i --rm -e TELER_CONFIG=/path/to/config/teler.yaml teler --input /path/to/access.log
Flags
teler -h
这将显示该工具的帮助。
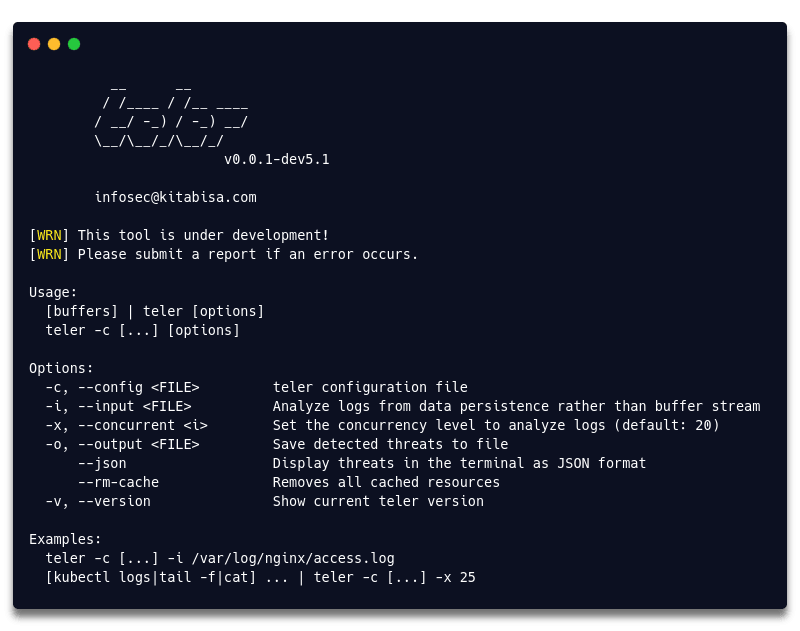
这是它支持的所有命令
| Flag | 描述 | 例子 |
|---|---|---|
| -c, -config | teler 配置文件 | kubectl logs nginx | teler -c /path/to/config/teler.yaml |
| -i, –input | 从数据持久性而非缓冲区流分析日志 | teler -i /var/log/nginx/access.log |
| -x, –concurrent | 设置并发级别以分析日志 (默认值:20) | tail -f /var/log/nginx/access.log | teler -x 50 |
| -o, –output | 将检测到的威胁保存到文件 | teler -i /var/log/nginx/access.log -o /tmp/threats.log |
| –json | 以JSON格式在终端中显示威胁 | teler -i /var/log/nginx/access.log –json |
| –rm-cache | 删除所有缓存的资源 | teler –rm-cache |
| -v, –version | 显示当前的teler版本 | teler -v |
设置
该-c标志用于指定远程配置文件。
tail -f /var/log/nginx/access.log | teler -c /path/to/config/teler.yaml
这是必需的,但是如果您定义了TELER_CONFIG环境,则不需要使用此标志,例如:
export TELER_CONFIG="/path/to/config/teler.yaml"
tail -f /var/log/nginx/access.log | teler
# 或者
tail -f /var/log/nginx/access.log | TELER_CONFIG="/path/to/config/teler.yaml" teler
输入项
需要增量日志分析吗?该-i标志对此很有用。
teler -i /var/log/nginx/access.log
并发
并发是同时分析的日志数。提供的默认值是20,您可以使用-x标志进行更改。
teler -i /var/log/nginx/access.log -x 50
输出量
您也可以将检测到的威胁保存到带有-o标志的文件中。
teler -i /var/log/nginx/access.log -othreats.log
JSON格式
如果要以JSON格式显示检测到的威胁,请使用--jsonflag对其进行切换。
teler -i /var/log/nginx/access.log --json
请注意,如果将其保存到带有-o标志的文件中,这也将适用。
删除缓存
它将删除用户级缓存目录中的所有存储资源,请参阅cache。
teler --rm-cache
配置
teler需要最少的配置来处理/记录分析,并执行威胁/警报。有关示例,请参见teler.example.yaml。
日志格式
因为我们使用gonx包来分析日志,所以您可以编写任何日志格式。举个例子:
Apache
log_format: |
  $remote_addr - $remote_user [$time_local] "$request_method $request_uri $request_protocol" $status $body_bytes_sent
Nginx
log_format: |
  $remote_addr $remote_user - [$time_local] "$request_method $request_uri $request_protocol"
  $status $body_bytes_sent "$http_referer" "$http_user_agent"
Nginx Ingress
log_format: |
  $remote_addr - [$remote_addr] $remote_user - [$time_local]
  "$request_method $request_uri $request_protocol" $status $body_bytes_sent
  "$http_referer" "$http_user_agent" $request_length $request_time
  [$proxy_upstream_name] $upstream_addr $upstream_response_length $upstream_response_time $upstream_status $req_id
亚马逊S3
log_format: |
  $bucket_owner $bucket [$time_local] $remote_addr $requester $req_id $operationration $key
  "$request_method $request_uri $request_protocol" $status $error_code $body_bytes_sent -
  $total_time - "$http_referer" "$http_user_agent" $version_id $host_id
  $signature_version $cipher_suite $http_auth_type $http_host_header $tls_version
Elastic LB
log_format: |
  $time_local $elb_name $remote_addr $upstream_addr $request_processing_time
  $upstream_processing_time $response_processing_time $status $upstream_status $body_received_bytes $body_bytes_sent
  "$request_method $request_uri $request_protocol" "$http_user_agent" $cipher_suite $tls_version
CloudFront
log_format: |
  $date $time $edge_location  $body_bytes_sent  $remote_addr
  $request_method $http_host_header $requst_uri $status
  $http_referer $http_user_agent  $request_query  $http_cookie  $edge_type  $req_id
  $http_host_header $ssl_protocol $body_bytes_sent  $response_processing_time $http_host_forwarded
  $tls_version  $cipher_suite $edge_result_type $request_protocol $fle_status $fle_encrypted_fields
  $http_port  $time_first_byte  $edge_detail_result_type
  $http_content_type  $request_length $request_length_start $request_length_end
威胁规则
缓存
默认情况下,teler每次运行时都会获取外部资源,但是您可以切换是否缓存外部资源。
rules:
  cache: true
如果您选择缓存资源,它将存储在跨平台的用户级缓存目录下,并且每天都会更新,请参阅参考资料。
排除项
我们包括针对预定威胁的资源,包括:
- 普通网络攻击
- IP地址错误
- 错误的Referrer
- 错误抓取
- 暴力破解
您可以在excludes配置中禁用任何类型的威胁(区分大小写)。
rules:
  threat:
    excludes:
      - "Bad IP Address"
上面的格式检测到不包含在错误IP地址中的威胁,并且不会分析日志/发送该类型的警报。
白名单
您还可以将白名单添加到teler配置中。
rules:
  threat:
    whitelists:
      - "(curl|Go-http-client|okhttp)/*"
      - "^/wp-login\\.php"
它涵盖了整个HTTP请求并作为正则处理,请谨慎编写!
通知
我们提供警报通知选项:
- Slack,
- Telegram
- Discord
在以下位置配置所需的通知警报:
notifications:
  slack:
    token: "xoxb-..."
    color: "#ffd21a"
    channel: "G30SPKI"

  telegram:
    token: "123456:ABC-DEF1234...-..."
    chat_id: "-111000"

  discord:
    token: "NkWkawkawkawkawka.X0xo.n-kmZwA8aWAA"
    color: "16312092"
    channel: "700000000000000..."
您还可以选择禁用警报或希望将其发送到警报所在的位置。
alert:
  active: true
  provider: "slack"
指标
teler 还支持使用Prometheus的指标。
Prometheus
您可以在配置文件中配置主机,端口和端点以使用Prometheus指标。
prometheus:
  active: true
  host: "localhost"
  port: 9099
  endpoint: "/metrics"
这是我们收集和分类的所有指标。
| 规则 | 描述 |
|---|---|
teler_threats_count_total | 检测到的威胁总数 |
teler_cwa | 获取常见的Web攻击列表 |
teler_badcrawler | 获取不良爬虫请求列表 |
teler_dir_bruteforce | 获取目录暴力破解 |
teler_bad_referrer | 获取不良referrer请求的列表 |
teler_badip_count | 错误IP地址总数 |